How to use Rewiring America’s Health Impact API
In this post, we’ll show you how to use the Health Impact API to access data most relevant to your work or research.
Over the past two years, Rewiring America has been assembling data and designing models around the benefits of electrification. We don’t want to keep all of this exciting work to ourselves. So we’ve decided to share it with the world through our API.
This post is part of a series of articles illustrating how you can incorporate the Rewiring America API to your website, research, and more. In the first post, we walk through how to add the Residential Electrification Model (REM) API to your website with HTML and JavaScript. In the second post, we discuss how to incorporate the REM API to your website using React. In the third post, we illustrate how to secure your API key.
In this post, we’ll show you how to use the Rewiring America Health Impact API to access data most relevant to your work or research.
About the Health Impact API
The Health Impact API is based on data and models we built to illustrate how the health of communities would improve if those communities were to electrify homes and businesses. (You can read the full report here.)
We created an API to give you access to the underlying data yourself, and created a step-by-step walkthrough of how to pull the information that’s most helpful for you and your team.
When working with APIs, it's often easiest to start with a working snippet of code that you can then modify to meet your needs. So we created a demo notebook on GitHub that illustrates a number of different ways the API can be called and the kind of responses it generates.
A first query
Our notebook begins with some basic imports and configuration.
First, we import requests, which is the standard package for making HTTP requests from Python.
import requests
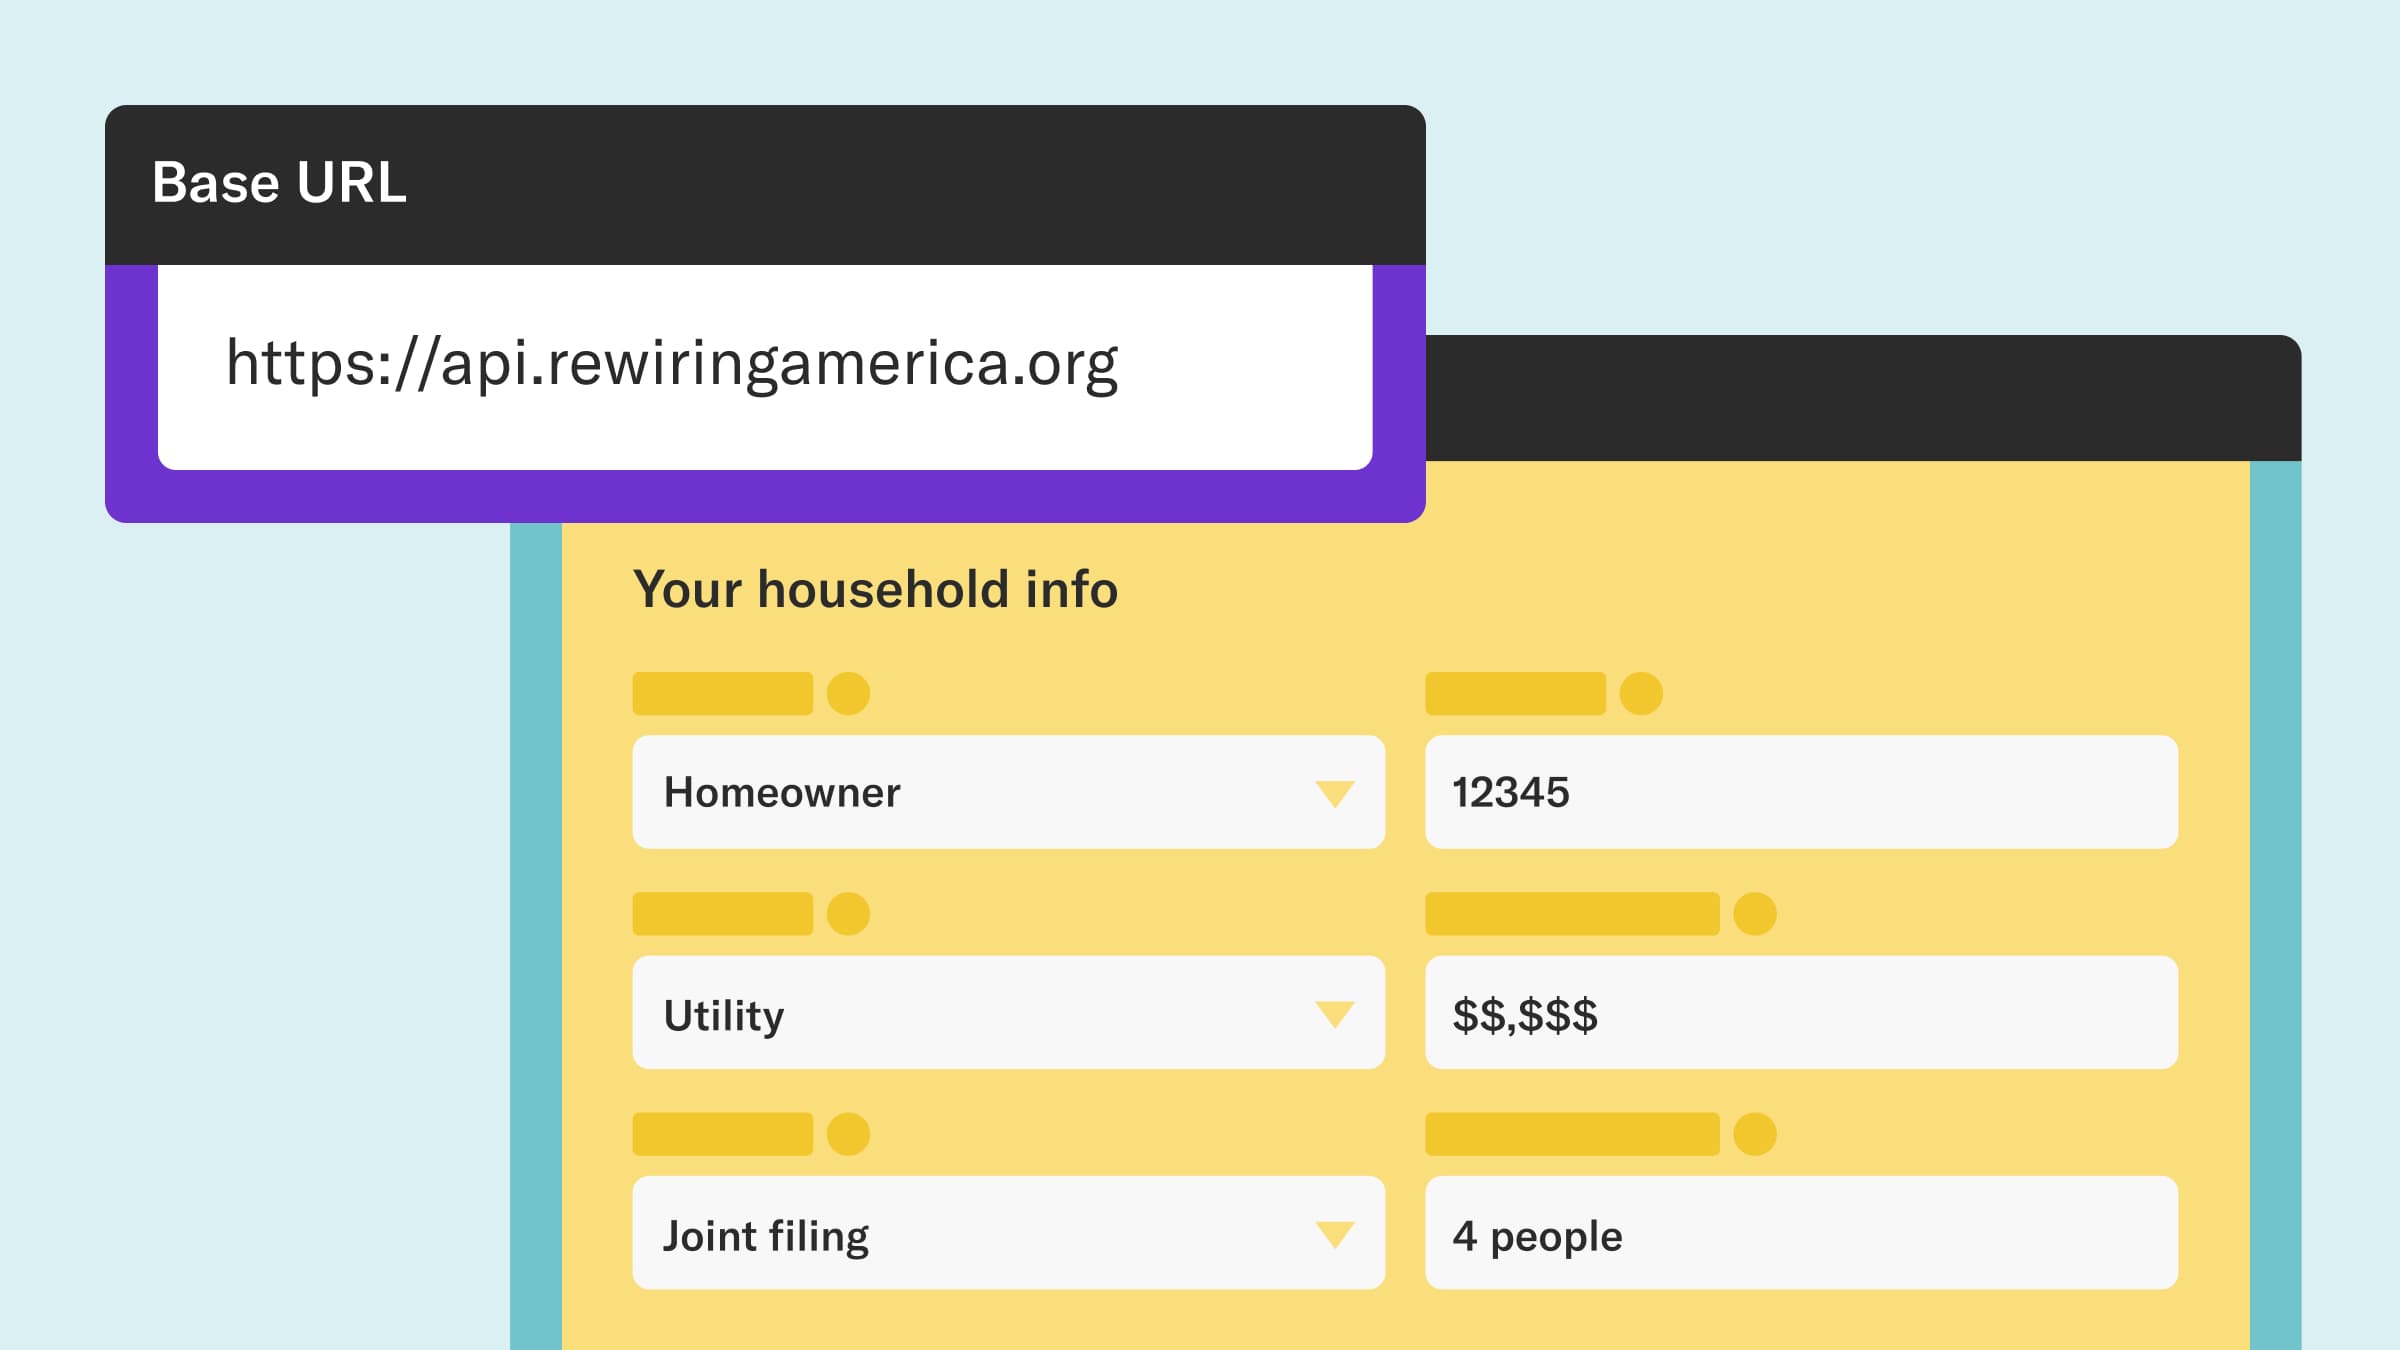
Next, we need a little bit of configuration to point to the URL of the API and to use our API key.
HOST = "https://api.rewiringamerica.org" REM_ADDRESS_URL = f"{HOST}/api/v1/rem/address" API_KEY = None # Put your API key here, or better yet in the file ~/.rwapi/api_key.txt
You can put your API key in here, but we discourage this since it is easy to inadvertently check in and share this code with your key in it. (Read more on how to avoid that here.)
Instead, as the comment suggests, we recommend you put it into a file in your home directory at ~/.rwapi/api_key.txt. If you use some other convention like a .env file, you can also use that instead.
Assuming you have used the recommended file location, you can read your API key with
if API_KEY is None: api_key_path = Path.home() / ".rwapi" / "api_key.txt" if api_key_path.is_file(): with open(api_key_path) as f: API_KEY = f.read().strip()
Now we have everything we need to make our first API call. We are going to query a single metric for the single state of Wisconsin, which will produce a single data point as output.
Our payload contains the arguments to the API:
payload = { "metrics": "premature_mortality_incidence_delta", "upgrade": "med_eff_hp_hers_sizing_no_setback", "state": "WI" }
In addition to the payload, we will send in some standard headers with each call, to indicate that we are sending the payload in JSON form and we expect the results to come back in JSON.
headers = { "Content-Type": "application/json", "Accept": "application/json", "Authorization": f"Bearer {API_KEY}" }
Now we can make the actual call.
# Make the API call: response = requests.post(URL, json=payload, headers=headers)
We will check the status code, which should be 200 to indicate that everything was OK.
response.status_code
Now we will make a data frame out of the JSON data that comes back from the call.
We asked for just one state to show, so the response will only display one row. It will also have a column to indicate the state name, in this case, WI. This will be more important when we ask for more than one state.
We asked for one metric — premature mortality incidence data — so it will have a column for that. It will also have a column for the number of households in the state.
It looks like this:

Querying for multiple states
Now let's make a second query. Just like in the first one, we pass in a single metric (premature mortality) and a single upgrade (a medium efficiency heat pump). But unlike in the Wisconsin example, we do not pass in a state. Therefore, we get results for all states in the continental United States.
payload_all_states = { "metrics": "premature_mortality_incidence_delta", "upgrade": "med_eff_hp_hers_sizing_no_setback" } response_all_states = requests.post(URL, json=payload_all_states, headers=headers)
Now let’s look at the response. It comes in a JSON format that is structured so that it can be directly converted to a Pandas data frame for convenient viewing and further analysis.
df_data_all_states = pd.DataFrame(response_all_states.json()["data"]) df_data_all_states
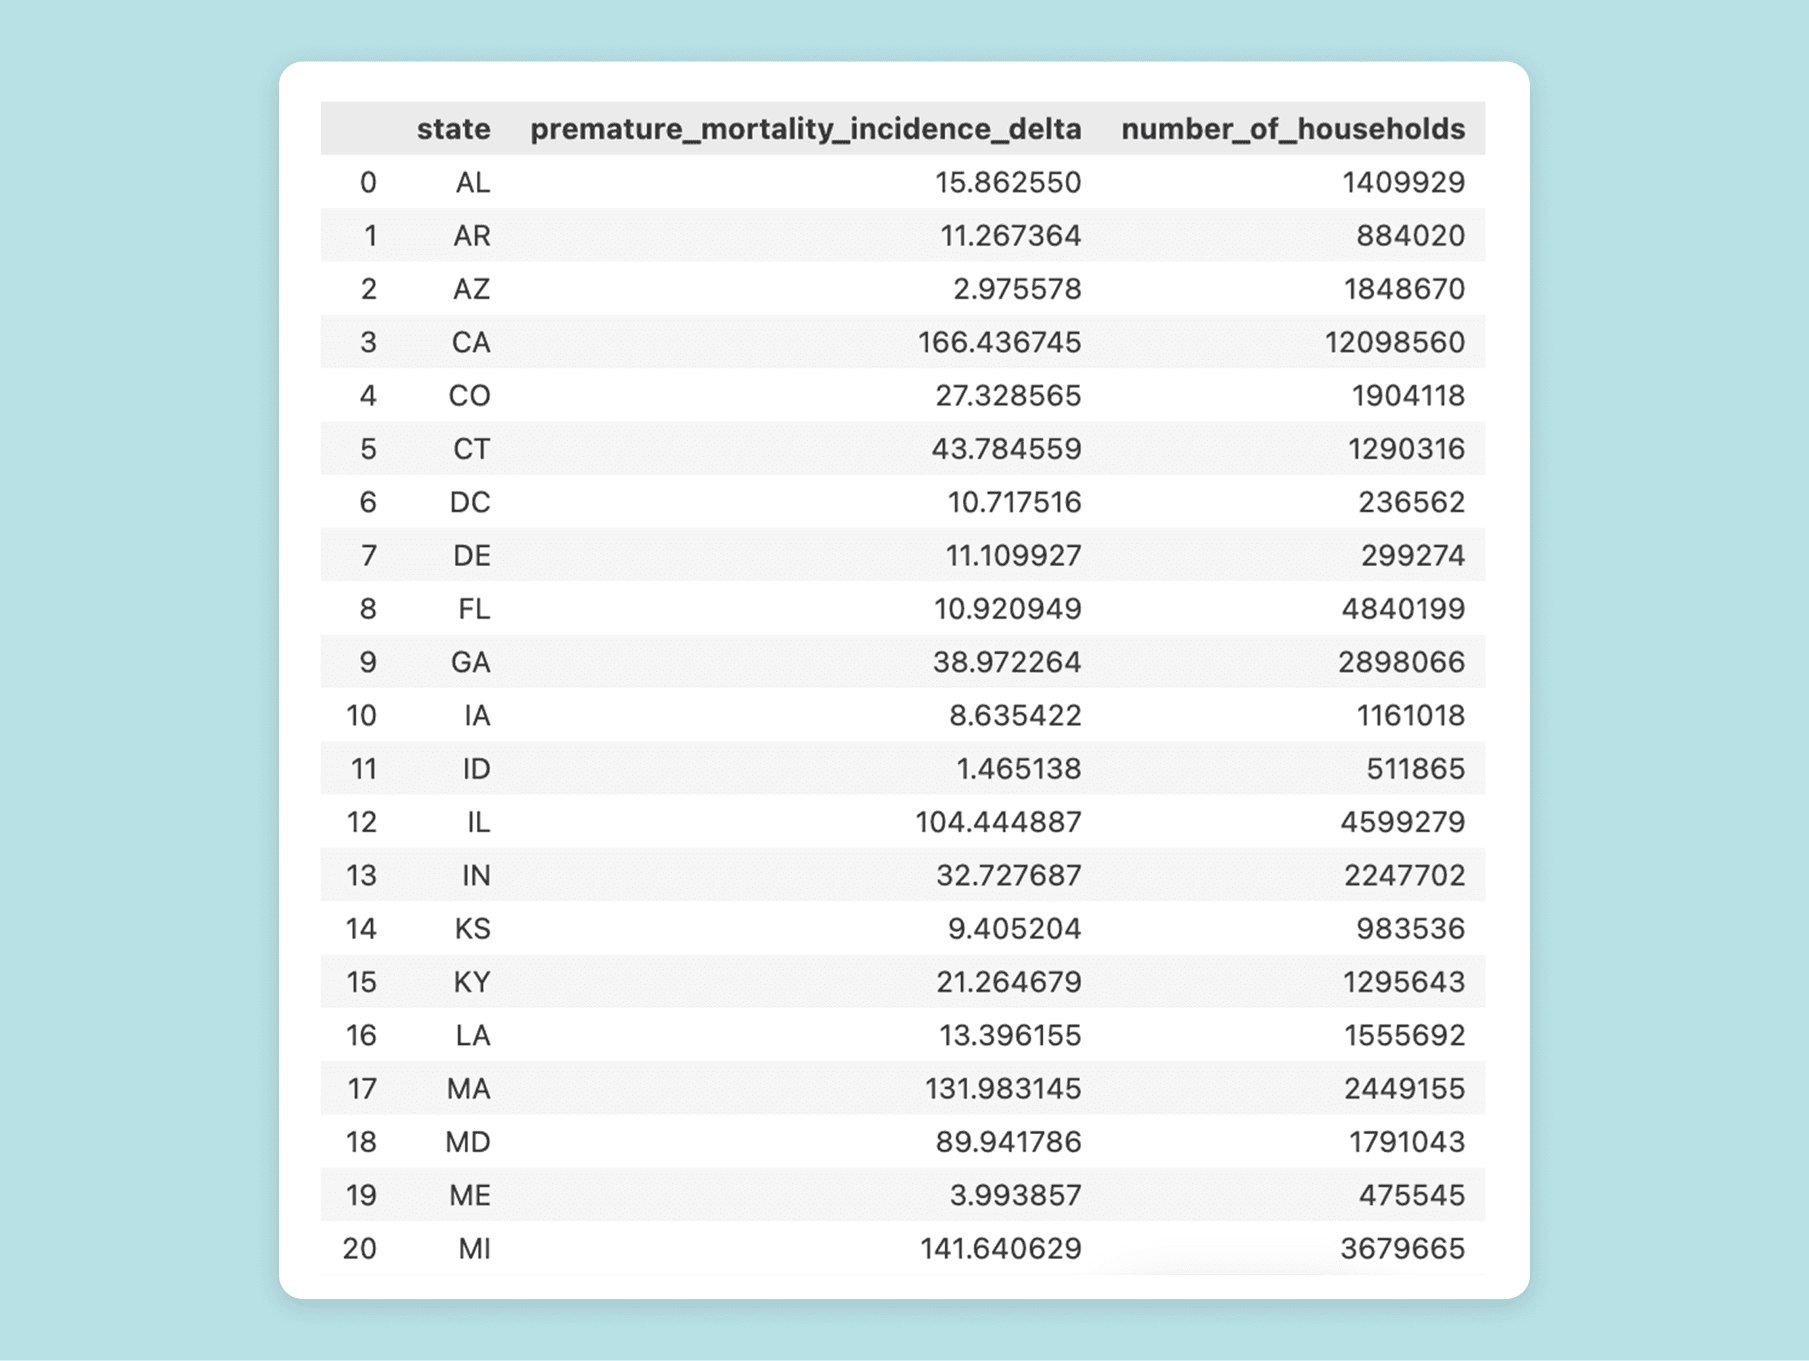
The resulting data frame has one row per state. The first 20 rows look like this:
If we scroll down further, the row for Wisconsin is exactly like the one we got in the first query:

Deriving new metrics
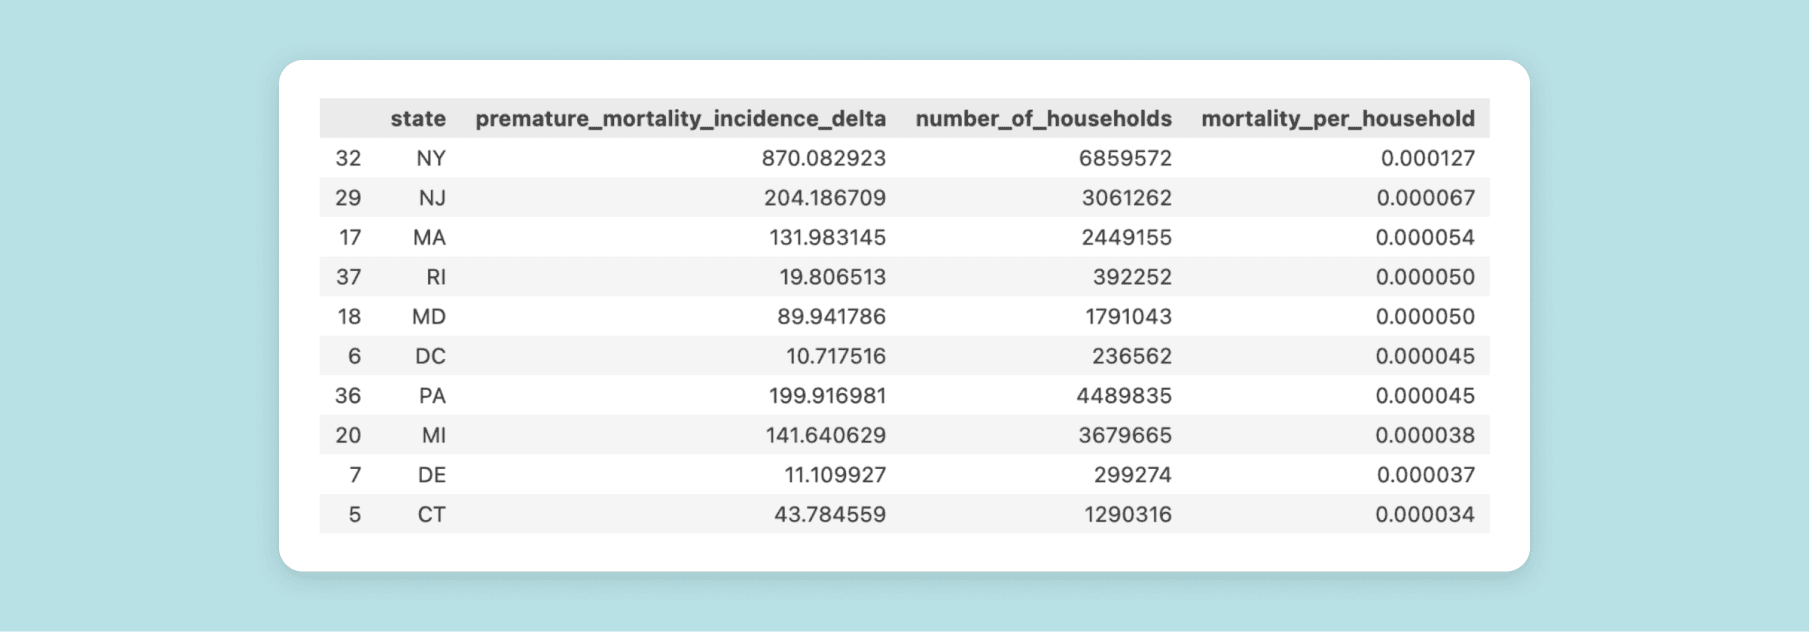
Since the data is in a data frame, we can manipulate it in a variety of ways. For example, we could add a column for the ratio of change in mortality to number of households. Then we can see which states have the highest value for that derived metric.
df_data_all_states["mortality_per_household"] = ( df_data_all_states["premature_mortality_incidence_delta"] / df_data_all_states["number_of_households"] ) df_data_all_states.nlargest(10, "mortality_per_household")
The result looks like this:
Querying data at the county level
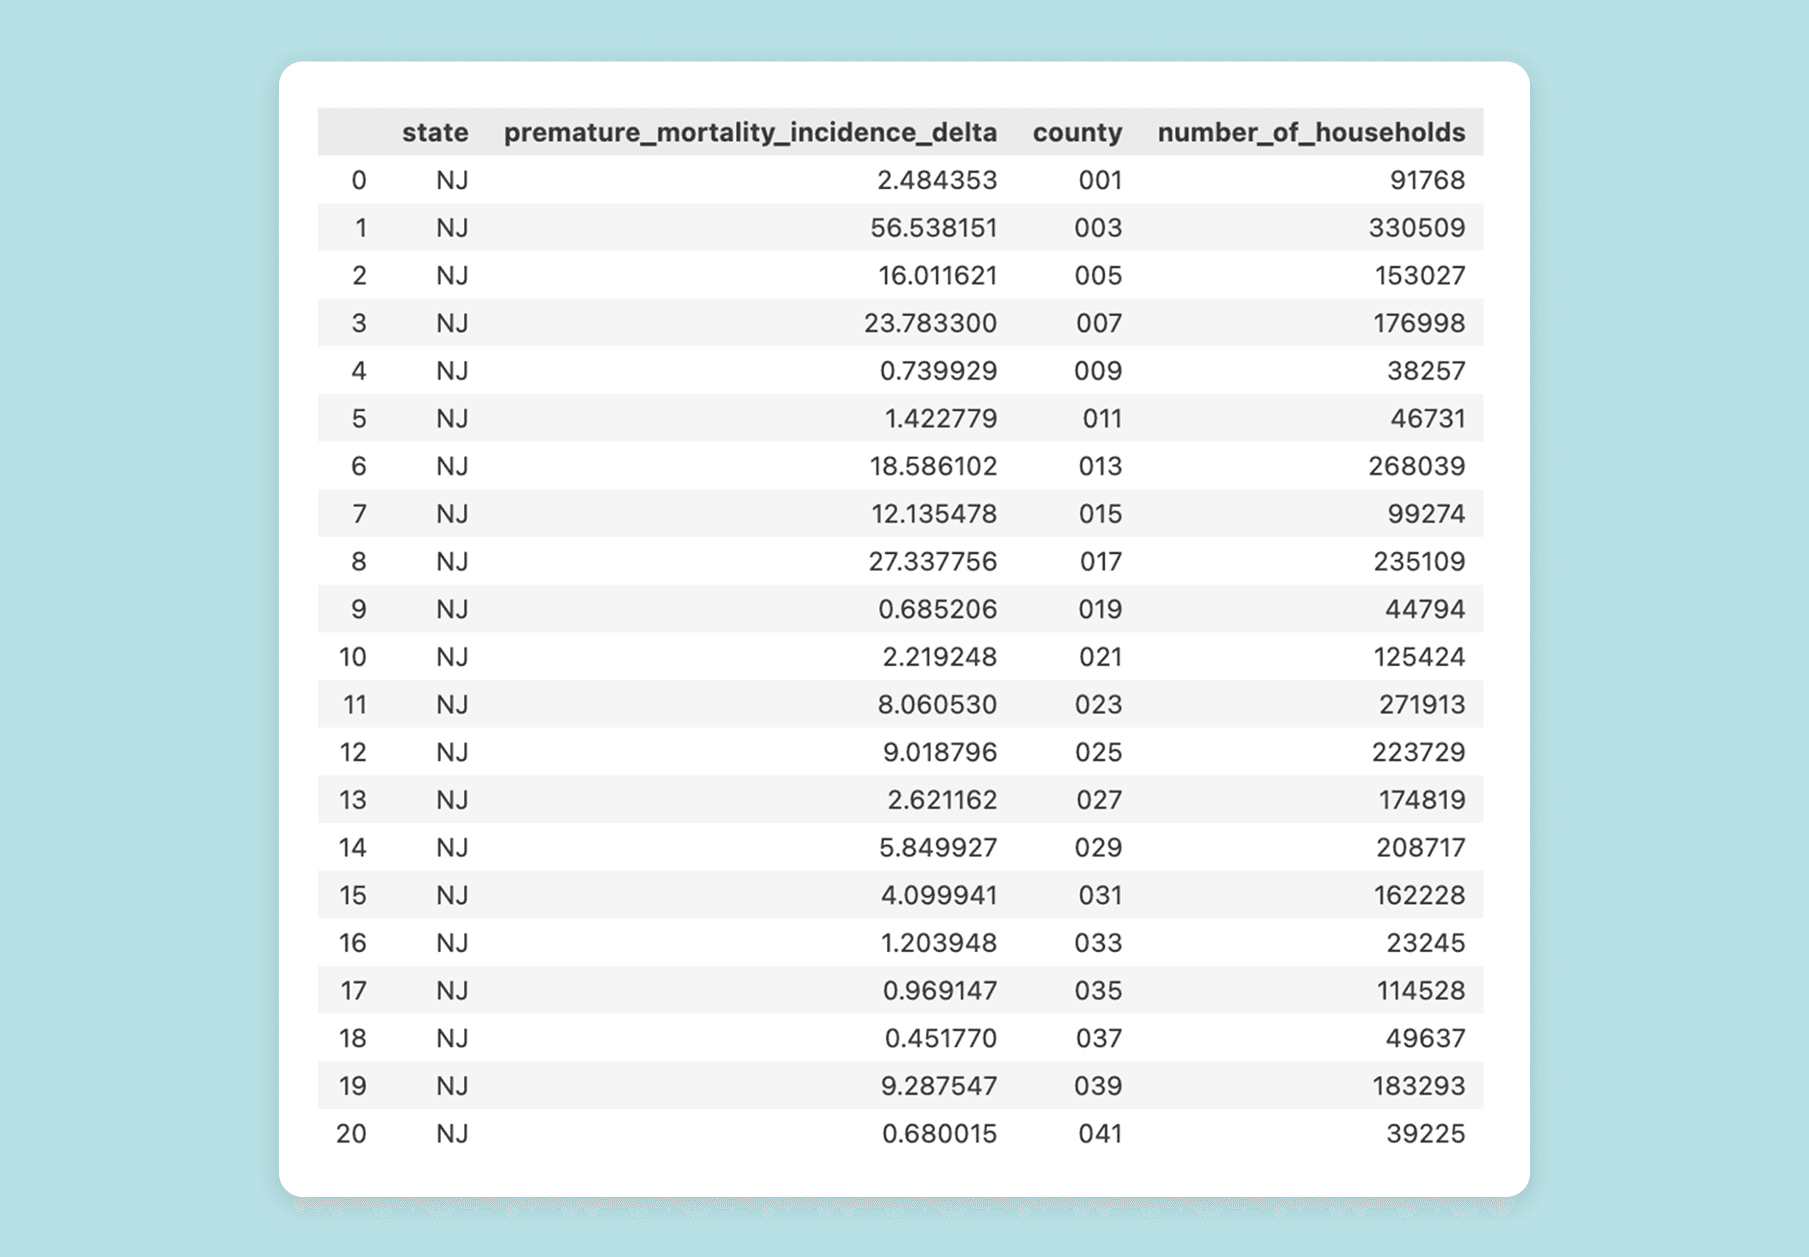
Next, we show how the API can pull more granular data — at the county level — in addition to the state level. Just as in the previous examples, we pass in a single metric (premature mortality), a single upgrade (a medium efficiency heat pump), a state (New Jersey), and a value of \"*\" for the county. This gives us results for all counties in New Jersey, broken out by county number.
payload_nj_counties = { "metrics": ["premature_mortality_incidence_delta"], "upgrade": "med_eff_hp_hers_sizing_no_setback", "state": "NJ", "county_fips": "*" } response_nj_counties = requests.post(URL, json=payload_nj_counties, headers=headers) df_data_nj_counties = pd.DataFrame(response_nj_counties.json()["data"]) df_data_nj_counties
For each county, we get the nationwide effects, just as we did for the Wisconsin and all states examples. The results are:
To check our work, we can add up the county-level numbers across New Jersey and compare them to the state-level result we got in our earlier all-state query.
statewide_nj_mortality = df_data_all_states[df_data_all_states["state"] == 'NJ']["premature_mortality_incidence_delta"].iloc[0] sum_of_nj_county_mortality = df_data_nj_counties["premature_mortality_incidence_delta"].sum() f"At the state level: {statewide_nj_mortality:.1f}; Summed over counties: {sum_of_nj_county_mortality:.1f}."
The results, just as we would hope, are the same.
'At the state level: 204.2; Summed over counties: 204.2.'
We hope you enjoy trying the API out. Be sure to let us know if you have questions or comments. Just raise an issue or open a discussion on our API Demos repository on GitHub.
Check out our other guides on using the Rewiring America API